The most important tasks for the growth of profitability and financial stability of a modern...
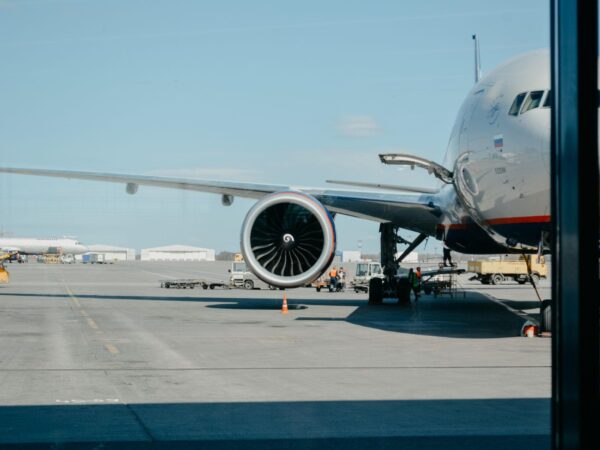
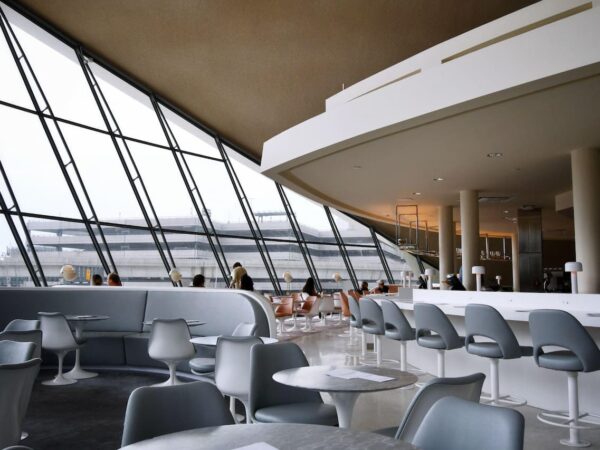
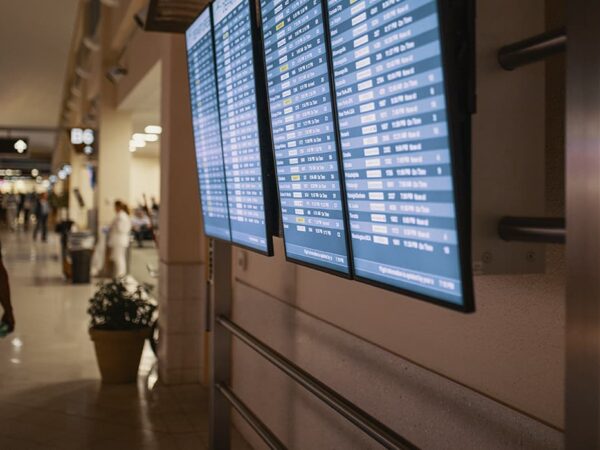
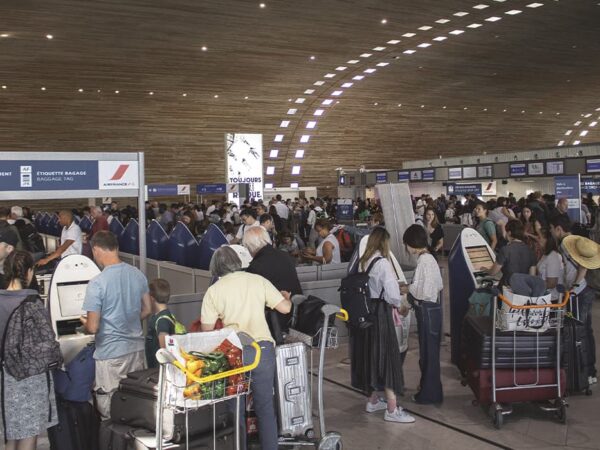
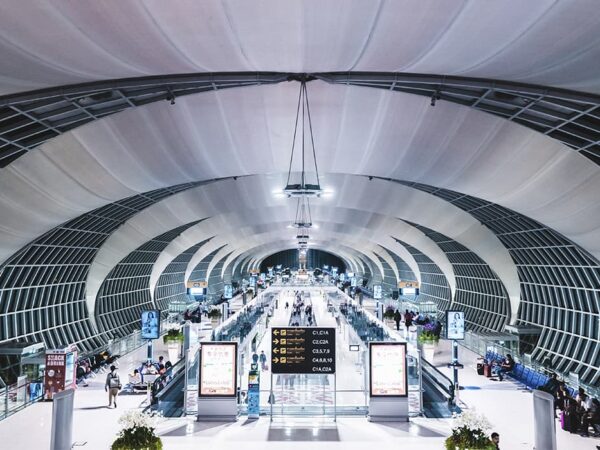
What does an air terminal consist of?
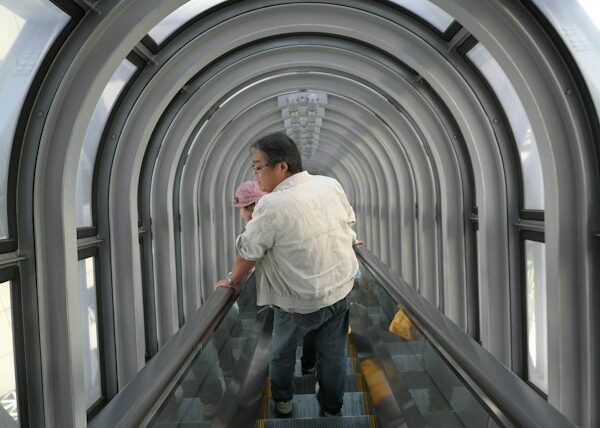
Zone before control Entrance ControlAn optional item. The security checkpoint is the most undemanding check you will encounter at the...
Airport management structure
In general terms, the management structure of an airport represents three main components: ? airport management, defined by its legal...
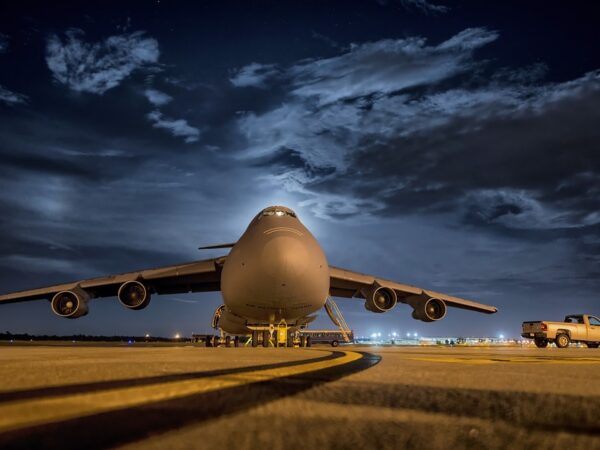
What is an airport operations manager?
Airport Operations Managers play an important role in providing safe and efficient air travel for passengers and cargo. An airport...